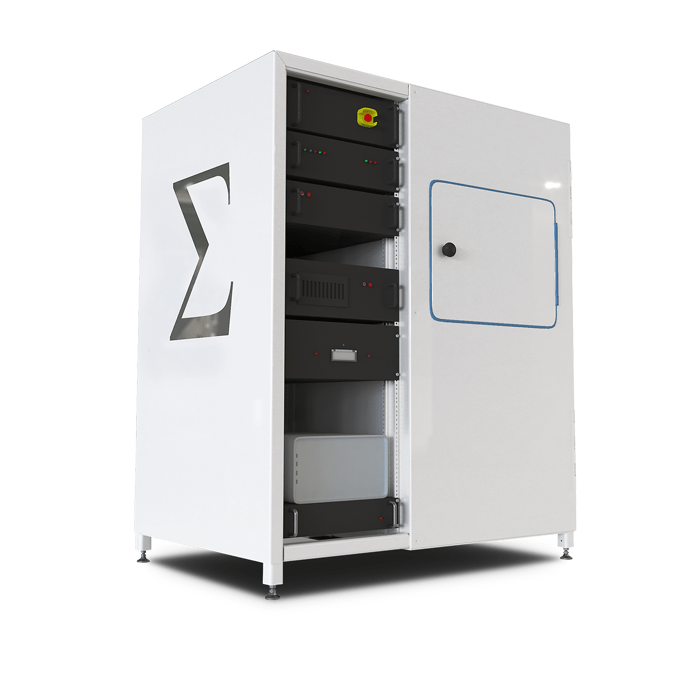
AttoMap
Micro XRF
Mineralogy for Mining & Oil and Gas
Measurements and elemental imaging to determine co-location of trace-level minerals and rare earth elements at ppm-scale is possible at microns-scale.
Quantitative Composition
Elemental composition and their relative percentages can be obtained for both point analysis and for larger regions, including specific regions of interest or the complete sample. Data is acquired and stored as a hypermap, with each pixel and its spectra, for ultimate flexibility in analysis.
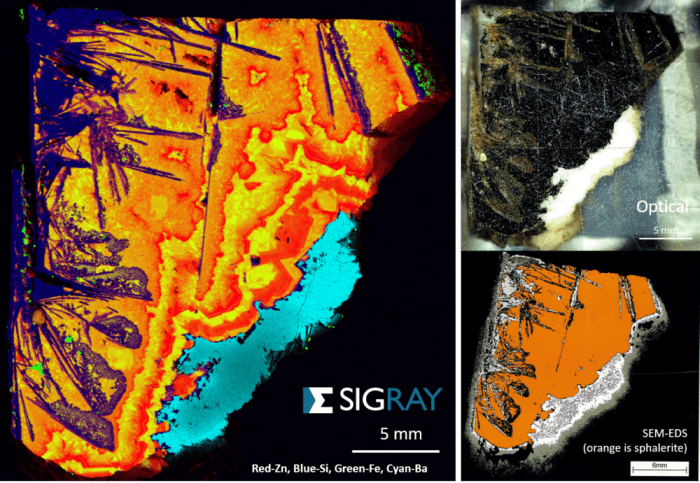
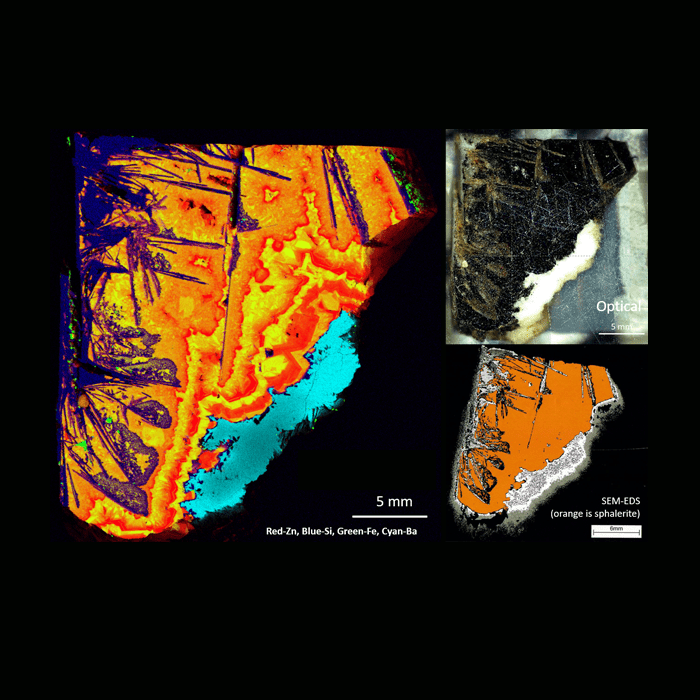
Correlation of AttoMap with Optical and SEM-EDS
Courtesy of Dr. Dieter Rammlmair, BGR Institute for Geosciences and Natural Resources
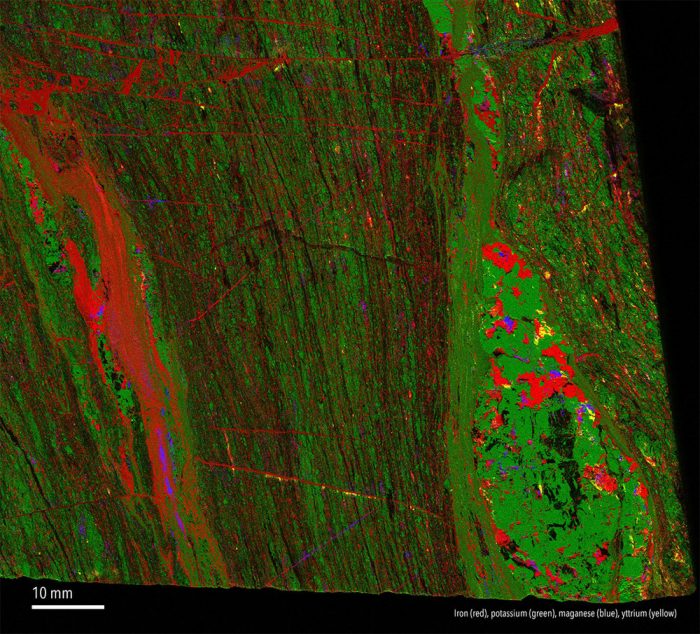
Rare Earth Elements in Rock
Four-color composite of a large rock sample, with yttrium (yellow) distributions shown. Other colors correspond to iron (red), potassium (green), manganese (blue)
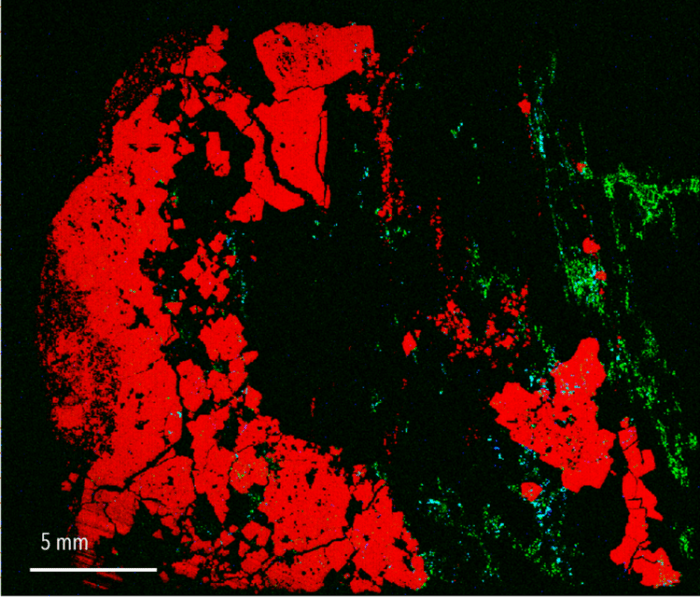
Pyrite Slice
Tricolor composite of a pyrite sample. Shown are Fe (red), Bi (green), and Pb (blue)
Courtesy of Dr. Wei Tan, Guangzhou Institute of Geochemistry
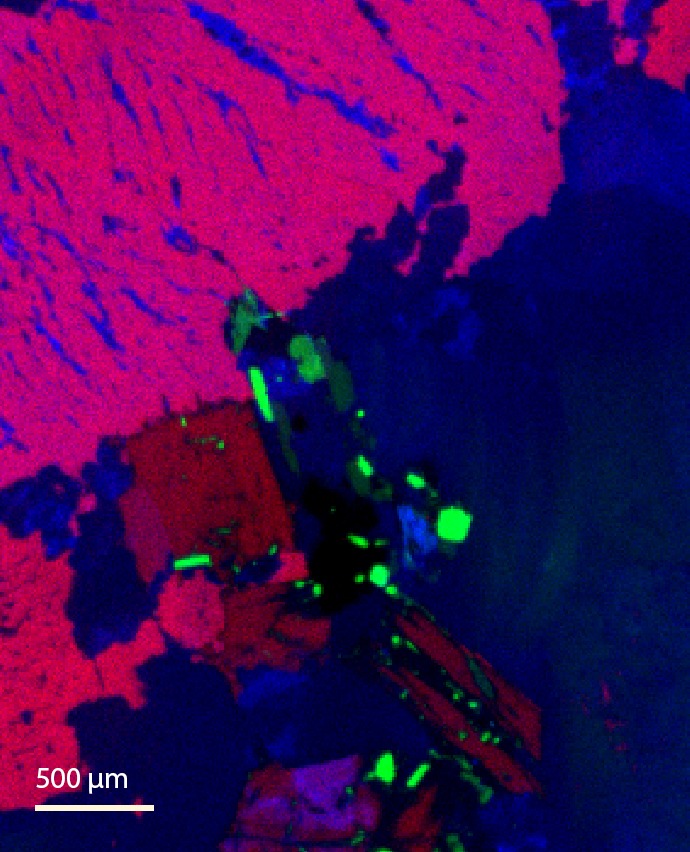
Granite Thin Section
Thin petrological section showing: Ca (green), Zn (blue), and K (red)
Courtesy of Dr. Ron Rasch, Centre for Microscopy and Microanalysis, The University of Queensland, Australia
