Automated Live Cell Imaging: The CX-A
Biological MicroscopyLive Cell ImagingMicroscopyQuantitative Phase ImagingTomographic Microscopy

Dose-response curves provide important pharmacodynamic properties (efficacy, potency, toxicity and lethality) for evaluating the performance of candidate drugs in the discovery pipeline. Half maximal effective concentration (EC50) values are a standard indicator of drug potency, but recent studies have raised concerns about the robustness and reproducibility of EC50 values generated using current methods, with highly variable values often observed between and within labs.
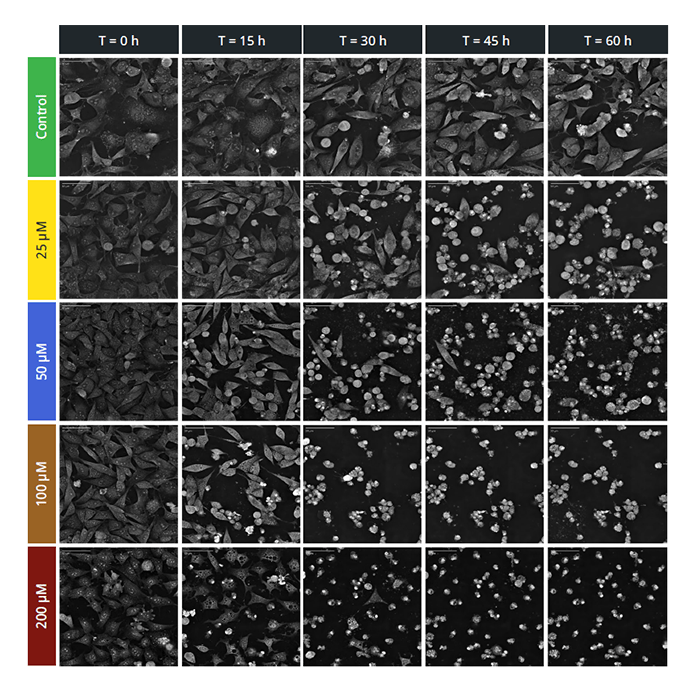
EC50 values are calculated from dose-dependent cell death assays. Most current studies use luminometric or fluorometric cell death assays (e.g., ATP, 5-DFDA-AM); fluorescence-based lytic end-point techniques that are problematic for many reasons. Firstly, multiple experiments are needed to cover all the concentrations and time points (a time consuming and costly process in terms of labour, reagents, and cells) and secondly, the use of fluorescence introduces cytotoxic/cytostatic effects into the results via the addition of the dye, or by phototoxicity-induced cell stress. The only way to produce 100% artefact-free EC50 values is by using label-free imaging.
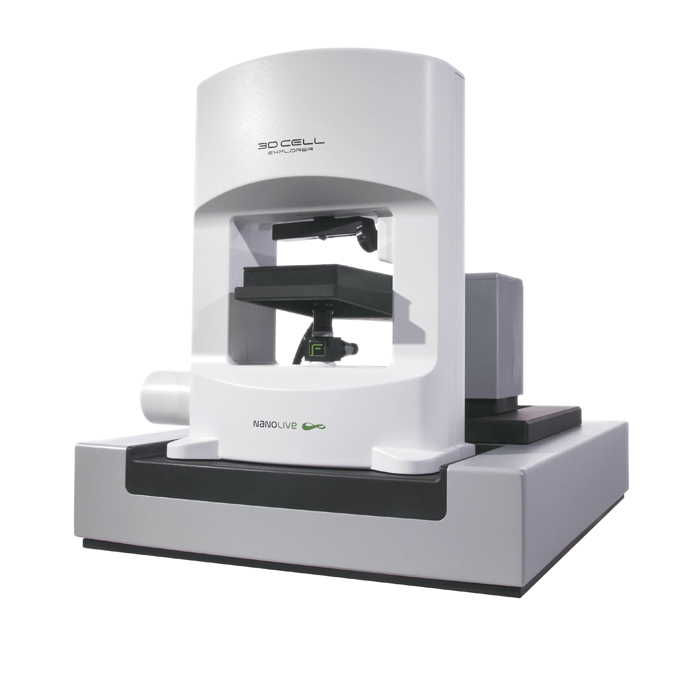
The non-invasive nature of label-free imaging which can be achieved using a Nanolive CX-A live cell imaging microscope means cells can be continuously monitored, over infinite periods of time, which means kinetic EC50 values can also be calculated. Time-dependent EC50 values provide information about drug stability; whether a drug’s potency increases or decreases over time.
