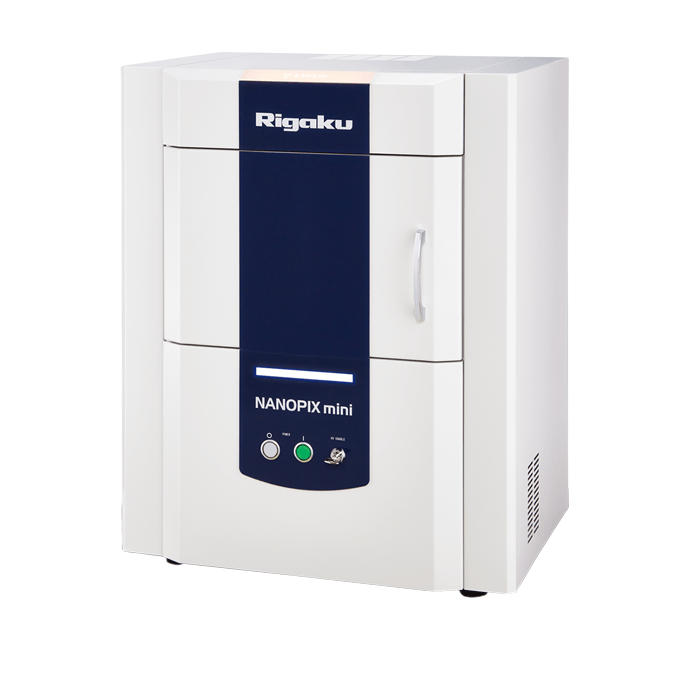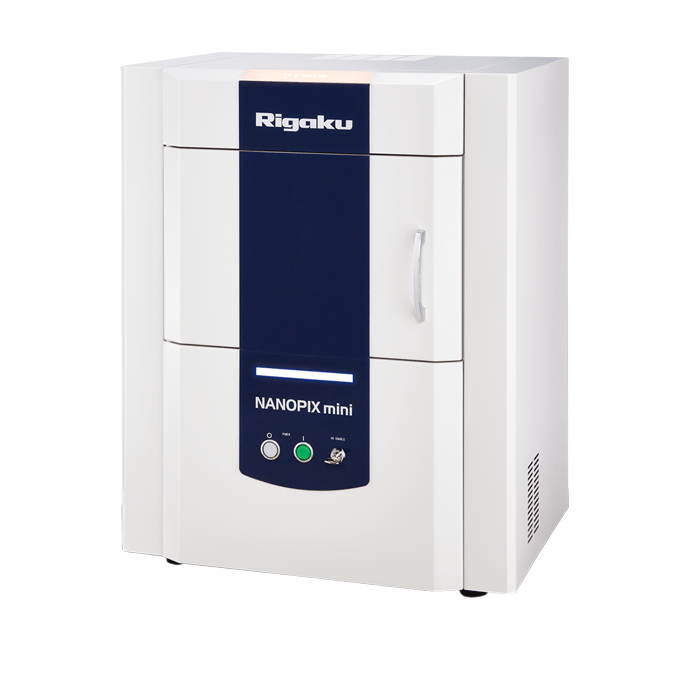
NANOPIX mini
SAXS/WAXS

Physical and chemical properties of nanoparticles and nanocrystalline materials are strongly influenced by their particle size, shape and structural strain, including rheology, surface area, cation exchange capacity, solubility, reflectivity, etc. Crystallite size is performed by measuring the broadening of a particular X-ray diffraction (XRD) peak in a diffraction pattern associated with a particular planar reflection from within the crystal unit cell. It is inversely related to the FWHM (full width at half maximum) of an individual peak: the more narrow the peak, the larger the crystallite size. This is due to the periodicity of the individual crystallite domains, in phase, reinforcing the diffraction of the X-ray beam, resulting in a tall narrow peak. If the crystals are defect free and periodically arranged, the X-ray beam is diffracted to the same angle even through multiple layers of the specimen. If the crystals are randomly arranged, or have low degrees of periodicity, the result is a broader peak.
Rigaku NANOPIX mini is the world’s first benchtop small angle X-ray scattering (SAXS) system that is engineered to deliver automatic nanoparticle size distribution analysis for both quality control (QC) and research and development (R&D) applications. Nanoparticle size, size distribution, and particle shape are the key pieces of information obtained from SAXS. Samples may range from solutions, suspensions or slurries to solid plastics, rubbers or polymers.
SAXS is a powerful method to determine both average particle size and size distributions. The plots show experimental data from silica nanoparticles as measured by the NANOPIX mini. The plot (below) shows the 1D SAXS pattern of measured intensity as a function of 2θ angle. NANOPIX mini software evaluates the 1D SAXS pattern (left side) and calculates the volume-weighted particle size distribution (right side). The average diameter is estimated to be 111 nm, which agrees with TEM image analysis.

