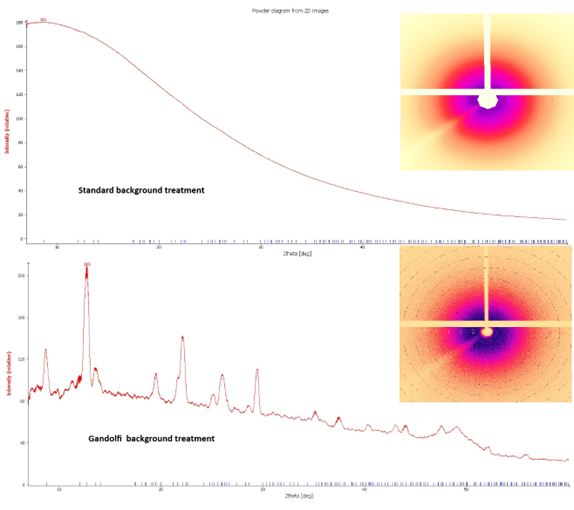
CrysAlisPro, used on all Rigaku Oxford Diffraction X-ray diffractometers allows the generation of powder diagrams from micro-powder and single-crystal datasets by applying simple frame accumulation and signal extraction from sum-up images. This is a helpful tool for quickly comparing experimental patterns, even before final crystal structure model refinement.
In the case of high background datasets and powder experiments collected from a cluster of single crystals using the Gandolfi method, simple frame accumulation may lead to high noise and a significant background hump on extracted 1D diffraction pattern. In the case of a very weak dataset, the background accumulation can even hide the sample signal completely, as shown in the figure below.

In such cases, it is recommended that the background computations be made in batches and their substructions made before final signal accumulation. The powder diagram extraction and calculations require more time, but the resulting diagram is much clearer.
To enable Gandolfi background treatment, access the Advanced powered extraction option window by selecting the option (1) button in the Powder Graph tool in CrysAlisPro. Locate and select the Gandolfi (for single crystal frames) option (2), confirm it with the OK (3) button, and repeat the analysis by hitting the Reprocess button (4). The simplified workflow is shown in the figure below.

A 25° range is recommended as default for all background treatments in CrysAlisPro. However, it can be adjusted from 5° to the length of the scan. The shorter the range, the better background and signal separation are expected, at the cost of longer computations.
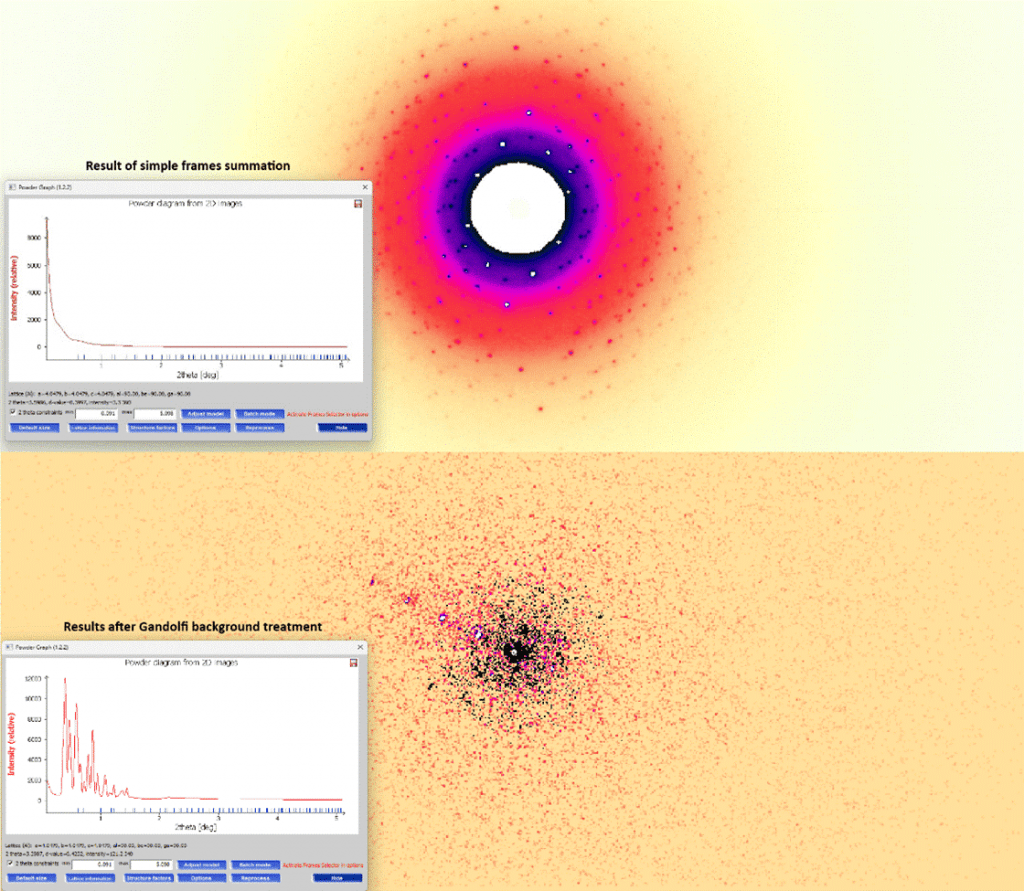
This background treatment is essential for signal extraction from 3DED datasets, as shown in the figure below.

