TESCAN micro-CT solutions lead the way in real-time, 4D imaging of fast dynamic processes. Our dynamic CT solutions feature intuitive acquisition setups for long-term experiments, with hundreds of uninterrupted rotations using second-scale temporal resolution in Acquila™. Complemented by advanced reconstruction, visualisation, and analysis tools in Panthera™, TESCAN delivers unmatched dynamic CT results available for all TESCAN micro-CT users.
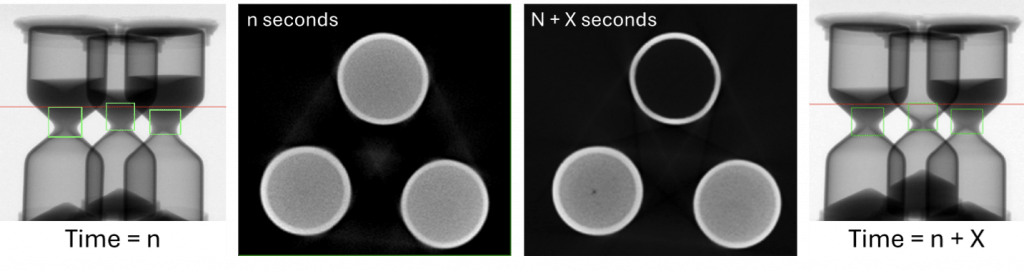
One challenge in long 4D imaging procedures is monitoring the progress of the experiment in real time. In many cases, X-ray projection images do not provide enough information on the internal processes, and real-time reconstruction during the experiment is required. Therefore, the TESCAN 4D Preview Tool was developed, to provide these insights, enabling researchers to have a better grasp on the experiments they are running. Within this tool, an intuitive slider-based selection can be made, to run through the acquired projection data, and visualise reconstructed data throughout the experiment. Additionally, fixed-angle projection images show what the 2D radiograph corresponding to a certain time step looked like (Figure 1).
Integrating acquisition and reconstruction does not stop at having real-time visualisation possibilities. Many dynamic processes are not continuous but happen in short discrete events. For example, brittle materials will not change greatly over time when you compress them but will break suddenly when the stress inside the material reaches a certain point. Similarly, for pore-filling events inside porous materials: when the pore pressure reaches a certain threshold, the next pore throat will be passed, and an additional part of the pore network will be filled almost instantly.
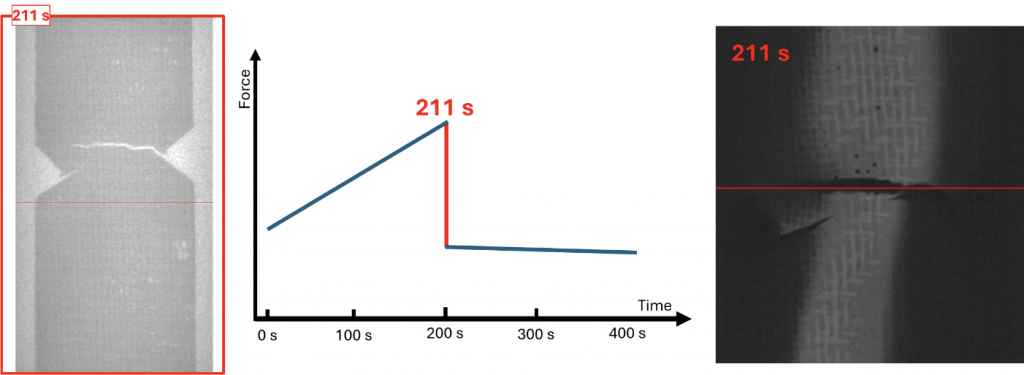
The TESCAN 4D Preview tool is designed for the optimal utilisation of all data acquired during the acquisition process. The many tens of thousands of projections can all be used, to start reconstructions at each possible projection and corresponding projection angle. This technique known as “sliding window reconstruction,” reconstructions can be tuned to match the exact moment events are happening, with sub-second precision down to the exposure time of a single projection. Moreover, it can be integrated with external sensor data, like the force read-out from a mechanical testing stage, to match reconstructions to the exact moment of a tested component’s failure (Figure 2).
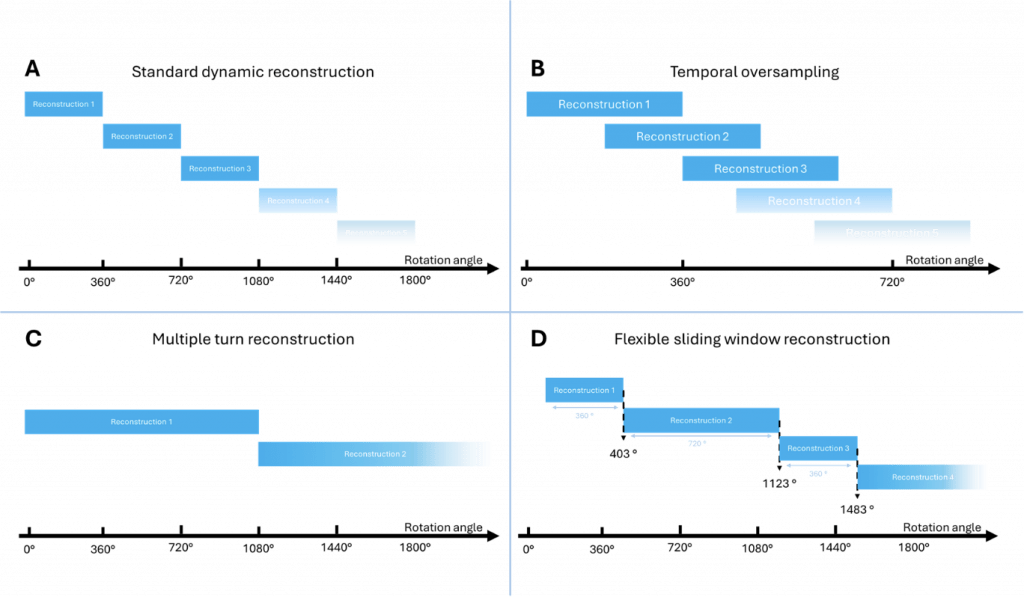
The 4D Preview Tool also enables temporal over-sampling, meaning that consecutive reconstructions are not started at 360-degree intervals, but at user-selected smaller intervals. Conversely, it is also possible to group multiple rotations to increase image statistics such as signal-to-noise ratio when processes unfold slower than expected (Figure 3).
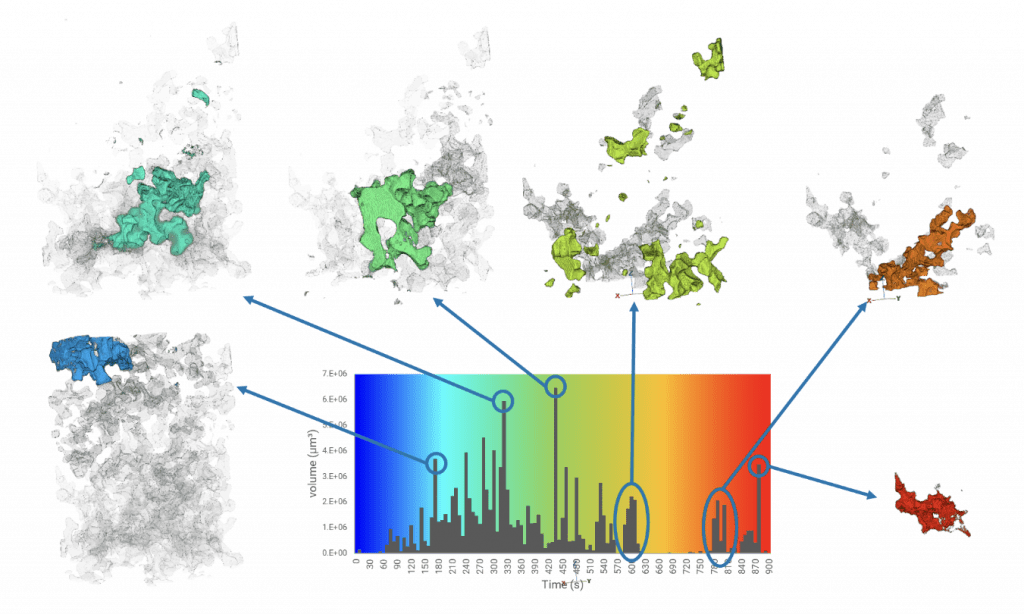
In the final phase, the TESCAN 4D tools within Panthera™ reconstruction and visualisation software allow users to process the many hundreds of gigabytes of data acquired in a dynamic CT experiment using straightforward workflows. One of the most significant of these workflows is the so-called flip-point analysis. Using just a few clicks, Panthera™ analyses the full series of 3D volumes and does a voxel-to-voxel comparison to the local attenuation values. Consequently, it can pinpoint and chronicle the precise moments of changes within a voxel – for example, the transition from an empty pore to a filled pore in a fluid flow experiment, Figure 4) can be tracked and mapped throughout the full duration of the experiment. Subsequently, the segmented, time-mapped data allows for the isolation and sequential examination of individual events.